Difference between revisions of "Graph options - DatLab"
From Bioblast
m (Gnaiger Erich moved page Graph options in DatLab to Graph options - DatLab) |
Beno Marija (talk | contribs) |
||
| Line 1: | Line 1: | ||
{{MitoPedia | {{MitoPedia | ||
|description=Several display options can be applied to a DatLab graph under '''Graph options'''. | |description=[[File:Graph-menu.png|right|200px]] | ||
Several display options can be applied to a DatLab graph under '''Graph options'''. | |||
|info=[[MiPNet19.18C DatLab-guide]] | |info=[[MiPNet19.18C DatLab-guide]] | ||
}} | }} | ||
Revision as of 12:01, 1 December 2017
Description
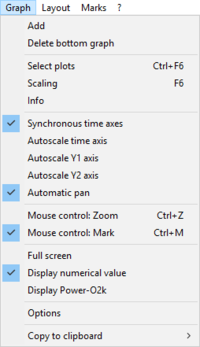
Several display options can be applied to a DatLab graph under Graph options.
Reference: MiPNet19.18C DatLab-guide
MitoPedia O2k and high-resolution respirometry:
DatLab
- Show legend: Lists the quantities plotted on each Y axis. Show legend is changed to option "off" with a left mouse click. In this setting plot names are not shown in the legend.
- Show gridlines: Provides an option to show or hide vertical and horizontal gridlines.
- Show marks [on/off]: Enables the user to hide marks for all graphs without deleting the marks.
- Show events [on/off]: Enables the user to hide events for all graphs without deleting the events.
- Font: Provides options for changing font size and style of axes labels and numbers.
- Event line style: Allows modification of event line styles.
- Show OROBOROS icon in clipboard files [on/off]: Option of displaying the OROBOROS icon in graphs when copying them to another file.
- Show seconds on time axis: An option for displaying seconds on the time axis' labels.

